Test-optional, explained: why published SAT scores went up when fewer students submitted them
The score ranges colleges publish are not the score ranges of their classes. Here's what changed, and how to decide whether to send your student's score.
If you've been looking at college websites lately, you've probably run into a number that doesn't quite add up.
A school your student would have been a solid candidate for five years ago now lists a middle 50% SAT range starting at 1450. Another one starts at 1460. The ranges look brutal, and the obvious conclusion is that these colleges got dramatically harder to get into.
Some of them did get harder. But most of that jump isn't selectivity. It's arithmetic, and once you see how it works you'll read every admissions page differently.
What test-optional actually means
A test-optional college lets applicants choose whether to send SAT or ACT scores. Send them if you think they help. Leave them off if you don't. Applications without scores get read on everything else: transcript, course rigor, essays, activities, recommendations.
That part is simple, and most families understand it.
What almost nobody is told is what test-optional does to the statistics those same colleges publish about themselves.
The number that changed, and the number that didn't
Colleges report their admissions data every year in a standardized document called the Common Data Set. It's public, it's boring, and it's where nearly every SAT range you've ever seen on a college website or in a rankings guide originally comes from.
One line in that document reports the share of enrolled first-year students who submitted an SAT score. Another reports the 25th, 50th, and 75th percentile scores.
Here is the part that matters: the percentiles are calculated only from the students in that first line. Not from the class. From the submitters.
We pulled the Common Data Sets for three schools, comparing the last pre-pandemic entering class to the most recent one on file.
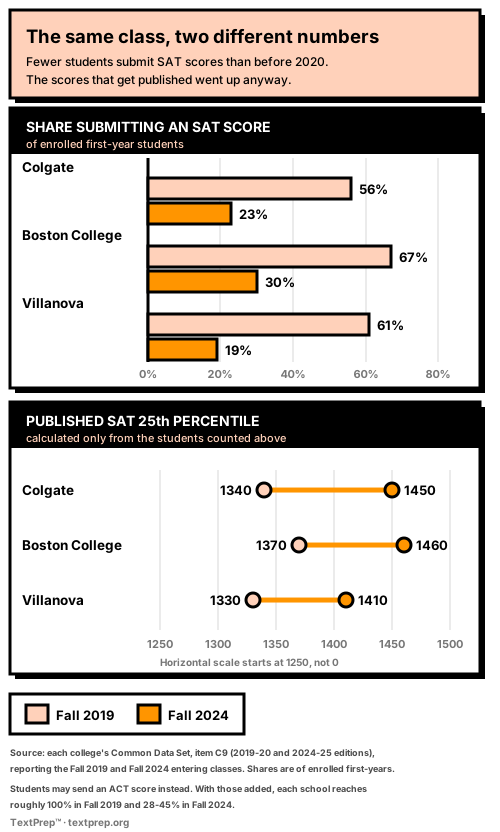
At Colgate, 56% of enrolled first-years submitted an SAT score in Fall 2019. By Fall 2024 it was 23%. Over the same stretch, Colgate's published SAT 25th percentile went from 1340 to 1450.
Boston College: 67% down to 30%, with the 25th percentile up from 1370 to 1460. Villanova: 61% down to 19%, 25th percentile up from 1330 to 1410.
Three schools, same shape. The pool of students being measured shrank by roughly two thirds, and the measurement went up by 80 to 110 points.
Why this happens, in one paragraph
Think about who chooses to submit a score at a test-optional college.
A student with a 1520 submits. Of course she does, it helps her. A student with a 1350 and a great transcript looks at the school's published range, decides her score doesn't help, and leaves it off. Both students might get in. Both might enroll. Only one of them shows up in next year's published SAT range.
Do that across a whole class and the published range stops describing the class. It describes the self-selected top slice of the class that chose to be described. Researchers call this selection bias, and it's the single most important thing to understand about admissions statistics right now.
The scores didn't rise. The sample changed.
One caveat we want to be straight about
The SAT isn't the only test. Students can send an ACT score instead, and the Common Data Set counts those separately.
So "56% submitted an SAT" in 2019 doesn't mean 44% of Colgate's class sent nothing. It means about 44% sent an ACT instead. Add the two lines together and you get roughly 100% of the class in 2019 at all three schools.
Do the same addition for Fall 2024 and you get somewhere between 28% and 45%. So the collapse is real either way, it's just smaller than the SAT-only line makes it look. We'd rather show you both numbers than let one of them do more work than it should.
What this means for the submit-or-not decision
The standard advice you'll read everywhere is: submit if your score is at or above the school's published middle 50%, don't submit if it's below.
That advice is built on a number that no longer means what it used to mean, and following it literally is stricter than it needs to be.
Here's the thing. A published 25th percentile of 1450 does not mean that a quarter of the enrolled class scored below 1450. It means a quarter of the students who chose to submit scored below 1450. The students who didn't submit aren't in that calculation at all, and there are three times as many of them.
We're not going to hand you a magic number, because there isn't one and anyone who gives you one is guessing. But a more useful way to think about it:
Lean toward submitting when:
- The score is at or near the published range. Near counts.
- Your student's transcript is good but the school profile is thin, few APs offered, no class rank reported. A score adds academic evidence the transcript can't supply on its own.
- The score is the strongest single number in the application.
Lean toward not submitting when:
- The GPA and course rigor are clearly stronger than the score, and the score would drag the reader's impression down.
- The score is well below the published range, not just a little under.
- Your student is applying to a school that's explicit about reading test-optional applications the same way.
And check each school's own page, because a few of them publish surprisingly direct guidance about who should submit. That guidance is more reliable than any rule of thumb, including ours.
Test-blind and test-flexible are different things
Two terms that get used interchangeably and shouldn't be.
Test-blind (sometimes "test-free") means the college will not look at scores even if you send them. A perfect 1600 gets ignored. The University of California and California State University systems are the best-known examples.
Test-flexible means the college wants some standardized evidence but will accept alternatives to the SAT or ACT, often AP or IB exam scores. It's rare, and the specifics vary a lot by school.
Both categories are small compared to plain test-optional, and policies change between cycles. Verify on the admissions page of every school on the list, every year.
The ground is still moving
During the pandemic, hundreds of colleges suspended testing requirements because test centers were closed. Many extended those policies for years afterward.
More recently, a number of highly selective universities have brought testing requirements back. MIT went first, and Dartmouth, Harvard, Yale, and Brown have all reinstated a requirement since. Their stated reasoning is roughly the same: their internal research found scores added predictive value, particularly for identifying strong students from under-resourced high schools.
Meanwhile plenty of schools have gone the other direction and made test-optional permanent.
There is no trend line to follow here. There's just a list of schools, each with its own current policy, some of which will change before your student applies.
So should your student take a test?
Yes, and this is the least complicated part of the whole subject.
Take at least one. Even if every school on today's list is test-optional, that list will change and so might those policies. A score you have is an option. A score you never took is a door that's closed by the time you notice it.
A good score gives your student something to submit. A disappointing score, at a test-optional school, simply doesn't get sent. The asymmetry is entirely in your favor.
SAT or ACT? Colleges treat them equally. There is no secret preference. The only question worth asking is which one your student performs better on, and the only way to answer it is a full-length practice test of each, compared by percentile rather than raw score. We wrote a longer piece on choosing between them if that's the decision in front of you.
Both? Usually only if the first one went badly, if the practice tests came out close, or if the list is heavy on schools where every marginal advantage matters.
Grades are still the main event
One misreading of the test-optional era is that testing got replaced by something else exotic. It didn't. It got replaced by the thing that was already carrying the most weight.
For most colleges the strongest signal in an application remains the transcript: the rigor of the courses, and the grades in them, over four years. Test scores are supporting evidence. Useful supporting evidence, sometimes decisive at the margin, but supporting.
If your student has to choose between an extra practice test and getting the calculus grade up, the calculus grade wins. It isn't close.
The short version
Test-optional made applications more flexible and admissions statistics much harder to read. The published SAT ranges you're comparing schools against describe a self-selected subset of each class, not the class.
So: take a test, keep the score in your pocket, submit it where it helps, and spend most of your energy on the transcript.
And if your student is going to sit for the SAT, the work that moves the score is the boring kind, done in small pieces over months rather than in a panic in October. Distributed practice beats cramming by a wide margin, and the hard part was never finding good questions. The hard part is showing up to them.
That's the whole reason we send one a day.
Figures in this post come from each institution's Common Data Set, item C9, for the 2019-20 and 2024-25 reporting years, which correspond to the Fall 2019 and Fall 2024 entering classes. Policies described here change frequently; confirm current requirements on each college's admissions website.
SAT and PSAT/NMSQT are trademarks of the College Board, which was not involved in the production of, and does not endorse, this content. TextPrep is not affiliated with, endorsed by, or sponsored by any of these organizations, and their names are used only to identify the test you are preparing for. All TextPrep practice questions are original and are not reproduced from any official test.